Recently, five private reserves that form the Associated Private Nature Reserves (APNR) in South Africa – a vital part of the Greater Kruger ecosystem – provided Africa Geographic with the data from their 2021 population censuses. We have sifted through this APNR census information to highlight the fascinating ebb and flow of nature and how reserve managers have to balance this against anthropogenic stressors to preserve the integrity of the ecosystem.
To do this, we start by looking at some of the key points from our analysis and provide important context for interpreting the results before breaking down the population trends for certain important species and families. [Editorial note: Due to security concerns, rhino trends and numbers have been omitted.]
INTERPRETING IN CONTEXT
- Wildlife counts are invaluable for reserve management teams but cannot be viewed in isolation. CONTEXT IS EVERYTHING, and while each member of the APNR conducts their own census every year (resources allowing), it is a connected ecosystem. Ideally, these population censuses should be interpreted in combination with those of the Kruger National Park because they share an unfenced ecosystem. This is particularly true for animals with massive home ranges like elephants, buffalo, and wild dogs.
- The counts have the potential to be meaningless without context and informed interpretation. Once the numbers are known, the real work begins for ecologists and managers – sorting through what is or isn’t important or relevant (or even natural) and finding explanations for anomalies.
- Interpretation involves consideration of many different aspects, including climate (rainfall in particular), increased land area (the addition of Thornybush Game Reserve to the APNR in 2018, for example) and the impact of other species.
- It is important to note specific correlations as the overabundance or scarcity of key species can significantly impact both the environment and other species.
- No count is ever 100% accurate and only provides a snapshot in time, so analysing trends is essential.
- This is not to say that individual results are insignificant. Local precipitous declines or overpopulations can indicate a serious problem that may not always have a natural or apparent cause.
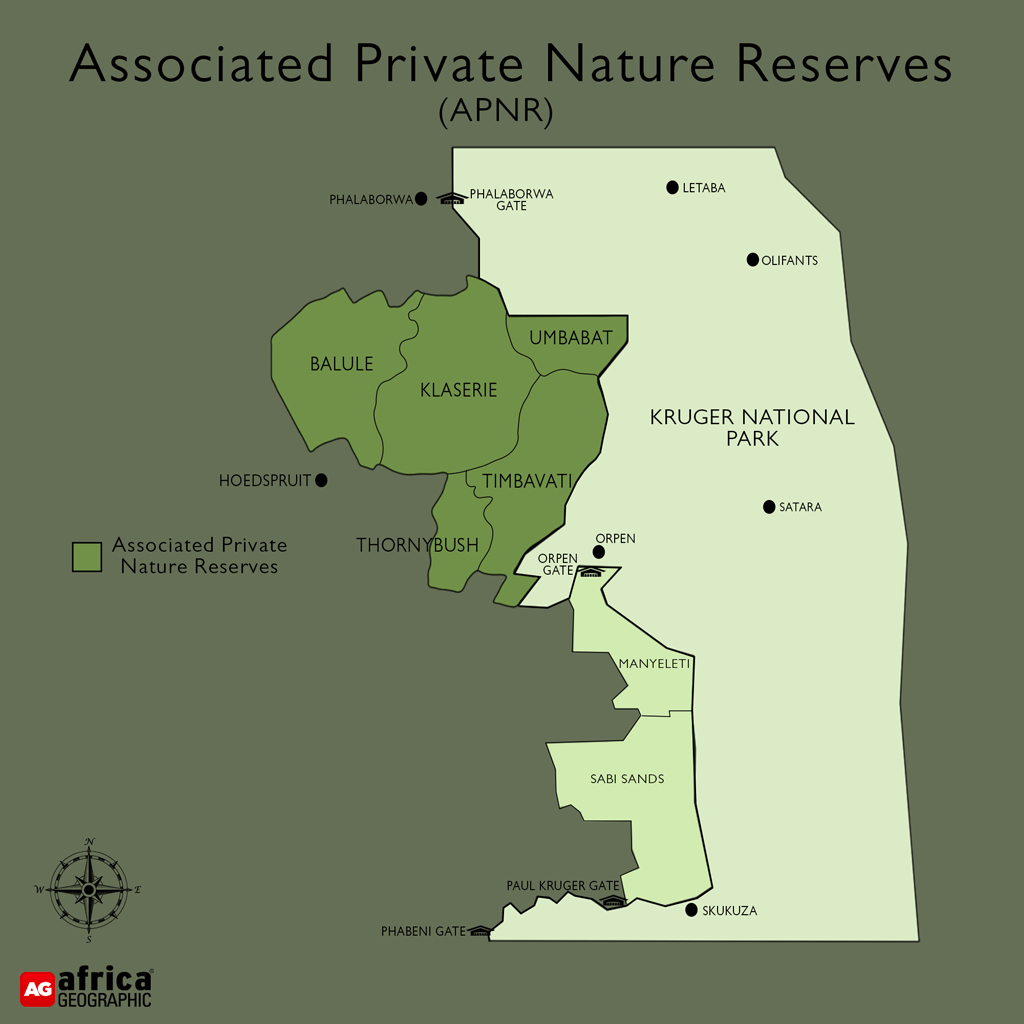
THE ASSOCIATED PRIVATE NATURE RESERVES (APNR) – BACKGROUND
The 197,885 ha APNR is an association of privately owned reserves on the western edge of the Kruger National Park. Initially, the APNR consisted of just three reserves: Timbavati Private Nature Reserve (53,395 ha), Klaserie Private Nature Reserve (60,080 ha), and Umbabat Private Nature Reserve (17,910 ha). These three reserves removed their fences bordering the Kruger National Park in 1993. Balule Private Nature Reserve (55,000 ha) joined the association just over a decade later, and the fences between Balule and Klaserie dropped in 2005. Thornybush Game Reserve (13,866 ha) became the fifth reserve to join when the fences between Thornybush, Klaserie and Timbavati were removed in 2018.
The combined APNR comprises nearly two-thirds of the entire Greater Kruger – 344,000 hectares (860,000 acres) of protected land to the west of Kruger National Park that provides a more substantial area for wildlife to roam freely. Other members of the Greater Kruger include the Sabi Sand Reserve, Manyeleti Game Reserve, Letaba Ranch Game Reserve, and Makuya Nature Reserve. Land use varies from private leisure to photographic tourism and trophy hunting on some properties. For those reserves that conduct hunting, wildlife censuses are necessary to set appropriate quotas each year.
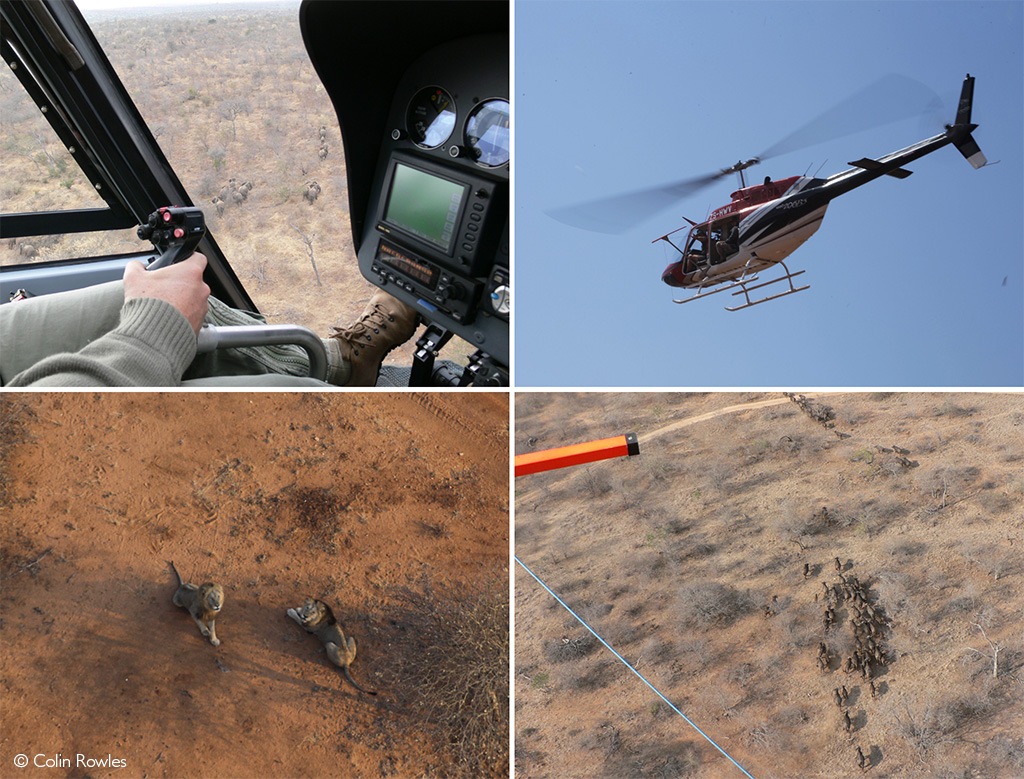
A WORD ON COUNTING
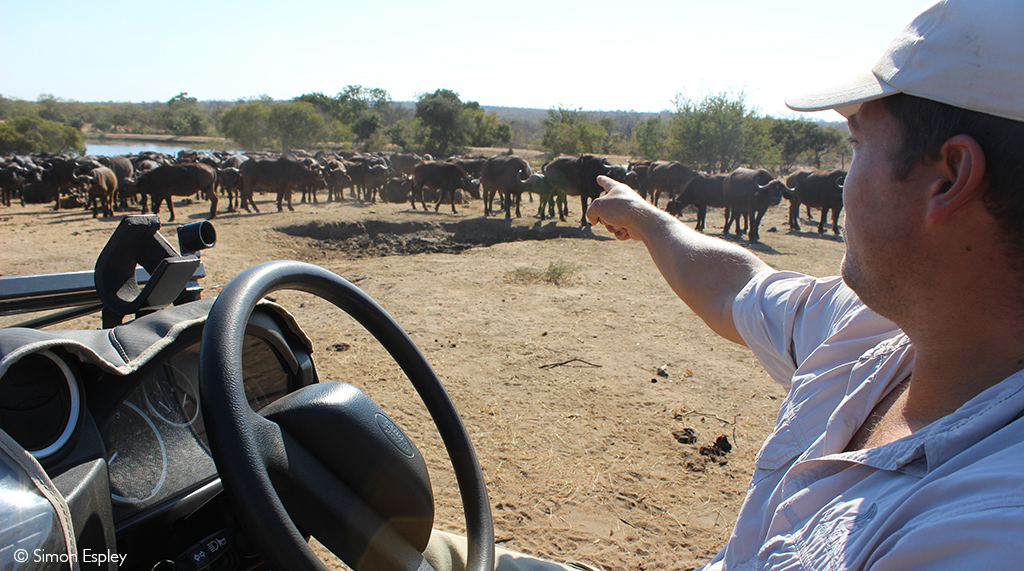
Counting wild animals is an enormous and costly exercise that requires that adaptive techniques for each species be balanced against the economic and logistical realities of each reserve. The APNR alone is roughly the size of Mauritius. The vast majority of the counts are conducted by air, with counters, spotters and data recorders spending days hanging out of a helicopter or plane. These are highly skilled individuals capable of not only spotting the animals but also often able to provide a breakdown of the demographics (males, females, and juveniles) of every animal seen. The counts are conducted towards the end of the dry season when vegetation cover is minimal, and the animals are more visible.
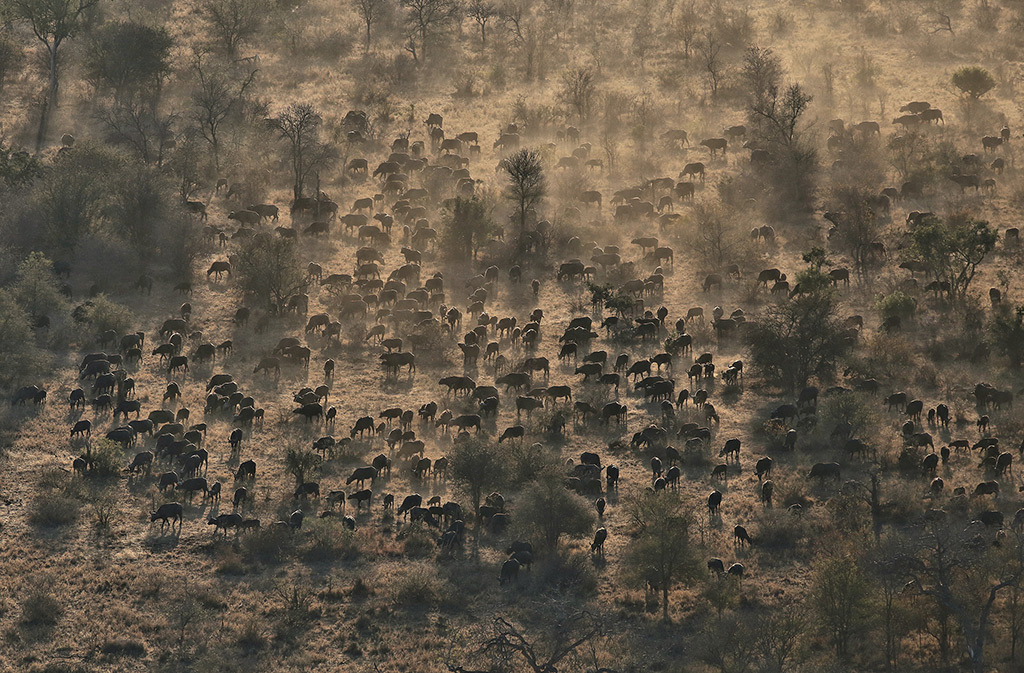
Larger animals like elephants and buffalo are generally easier to count (and fewer in number than, say, impala), so population estimates tend to be more accurate. Large herds (like breeding herds of buffalo) can be photographed, and these high-resolution images can then be used to count individuals. Though all animals spotted from the air are recorded in each census, common sense plays a role in interpretation. For example, a sighting of only one lion in Thornybush’s 2021 aerial count does not mean that there is only one lion on the reserve.
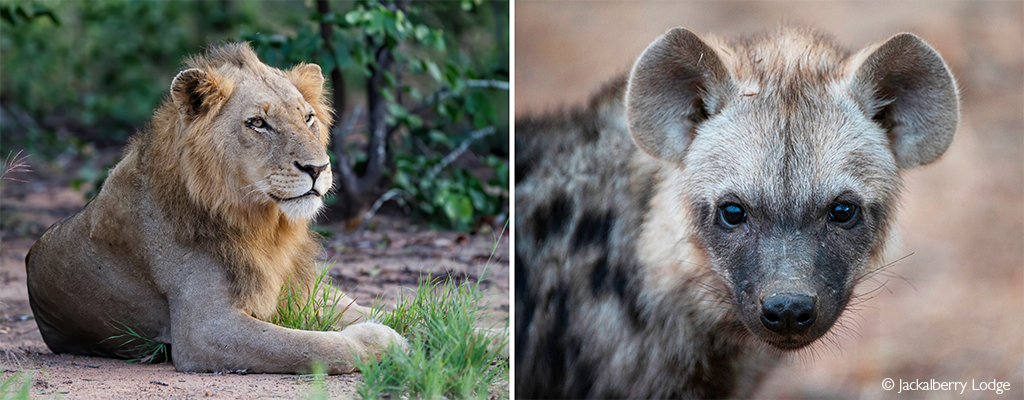
Furthermore, though predators are often spotted from the air, aerial counts do not provide accurate population estimates, particularly for cryptic animals like leopards and some smaller carnivore species. As a result, some reserves use camera traps and sightings information and conduct call-ups for their predator census. A call-up count involves placing bait and playing the sound of a prey species in distress over a speaker. The sound generally attracts the lions, spotted hyenas, and the occasional leopard and smaller carnivore. Wild dogs (painted wolves) and cheetahs are less likely to respond, even during the day and alternative methods have to be implemented if a population estimate is required. These predators also have large home ranges and regularly move in and out of reserves.
Predator populations are fluid and dynamic, fluctuating depending upon a variety of circumstances, including both inter- and intraspecific competition.

TRENDS AND THE 2016 DROUGHT IN GREATER KRUGER
The idea of a “stable” population is somewhat misleading, as there is no such thing in nature and, in reality, long-term wildlife populations fluctuate, ideally within a sustainable range. This range is determined by the carrying capacity of the reserve, dictated by geography, climate and flora of the landscape. Even when a once-off disaster (a disease outbreak or drought) causes a more dramatic decline in numbers, the species concerned often recover, provided their previous numbers were sufficiently robust.
The ebb and flow is evident throughout the data from all five reserves, especially concerning buffalo numbers during and after the 2015/2016 drought. Though the number of buffalo dropped substantially during the drought period, it is important to note that this is largely accounted for by the movement of buffalo herds to more favourable habitats to the east (in the Kruger National Park). Trends such as these emphasise the importance of large connected habitats. The 2016 drought was the first drought experienced since the removal of fences between the APNR and the Kruger National Park. This, in turn, allowed for greater ecological resilience in the face of extreme conditions.
Even as rainfall levels increased in later years, the return of the buffalo and the recovery of other ungulate numbers were by no means instantaneous, and lag effects were to be expected. What’s more, knock-on effects were experienced in other, less obvious ways. For example, deprived of buffalo, resident lions would have been forced to rely more heavily on other species for sustenance. There is also a seasonal change in prey species selection, with more wildebeest killed by lions during the wet season and weakened buffalo targeted during the dry season.
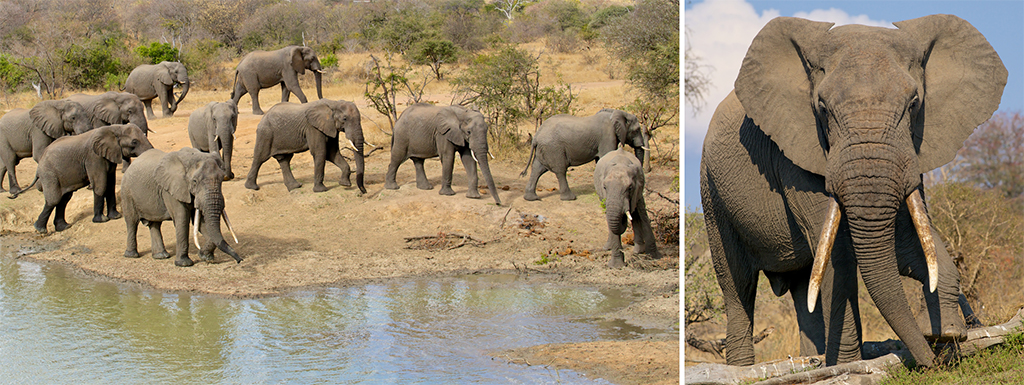
ELEPHANTS
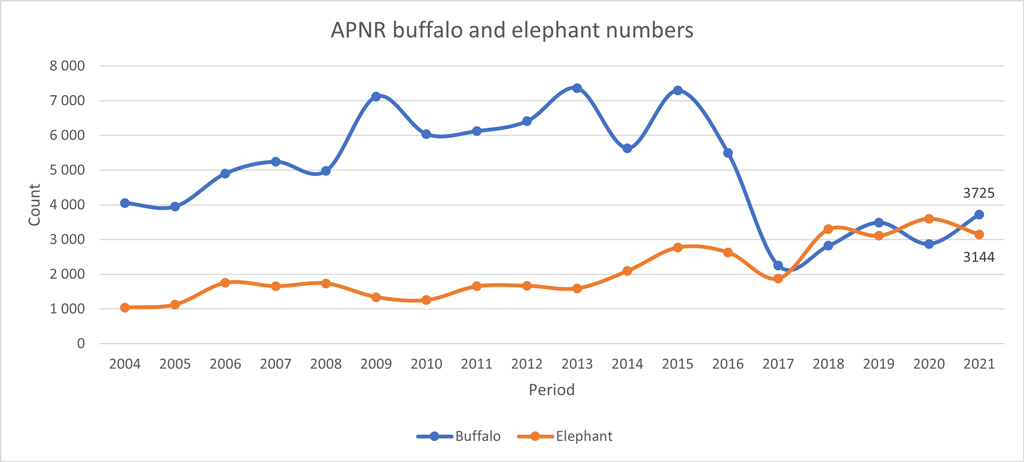
Entire APNR – Elephant numbers in the APNR have gradually increased since 2004, when the population stood at around 1,038. The population peaked in 2018 (3,297). In 2021, the total count from all five reserves was 3,144 elephants.
Balule – Balule has seen the most significant increase in elephants utilising the property over the past four years – 86%. 1,053 elephants were counted in 2021, representing the highest population (and density) of the five reserves. The demographics of the elephants entering Balule have also gradually changed since the reserve opened to the rest of the APNR in 2004. Initially, young males dominated, but today, breeding herds and calves are firmly in the majority.
Klaserie – 718 elephants were counted in 2021, increasing 62% since 2017.
Timbavati – 875 elephants were counted in 2021, compared to the 465 in 2017 (a nearly two-fold increase).
Thornybush – When Thornybush dropped its fences in 2018, the number of elephants in the reserve shot up from just over 50 individuals to 349. The population peaked at 770 before decreasing to 368 again in 2021. This increase and then decrease could be explained by the after-effects of the drought and the return of good rains in subsequent years. The dense, nutritious habitats that dominate much of Thornybush were more attractive to elephants until the flora in other regions recovered, resulting in some of the herds dispersing.
Umbabat – 130 elephants were counted in 2021. However, Umbabat elephant counts have varied considerably over the past four years, possibly explained by its relatively smaller size and close proximity to the Kruger National Park.
BUFFALO
Entire APNR – During (and almost exclusively due to) the 2015/2016 drought, the APNR buffalo population dropped from 7,291 to 2,251 in just two years. However, numbers have been slowly increasing with a couple of years’ worth of good rains, and the 2021 count stands at 3,725. Individual counts from the various APNR reserves are highly variable due to the nature of buffalo herds and the “snapshot” of the count. A breeding herd of over 500 may decide to leave the property the day before a count or arrive a day after. This is one area where an overall trend is more revealing.
PREDATORS
LION AND SPOTTED HYENA
Balule – Balule has experienced substantial growth in its lion population over the last decade. However, the verified numbers from the 2020 and 2021 censuses indicate a stabilisation and a minor decline, from 137 to 124 individuals. Curiously, Balule’s lion population has been nearly double that of neighbouring Klaserie and Timbavati in recent years. This could be partly explained by high prey biomass, but of particular interest is the high proportion of mature and young males in Balule compared to “normally” observed demographics. The managers theorise that may be due to the reserve’s geographical location. Young dispersal males may be pushed continually further west until they reach Balule, which marks the western boundary of this section of the Kruger ecosystem, where they can go no further without breaking out of the protection of the reserve. However, this leaves unanswered questions about Klaserie as the immediate neighbour to the east (see below).
Typically, high lion densities are associated with lower spotted hyena numbers, but this is not the case in Balule. 96 individual spotted hyenas were identified during the 2021 predator census, suggesting that spotted hyena densities in Balule are roughly on par with the surrounding reserves.
Klaserie – Klaserie’s call-up predator census in 2021 yielded a count of just 18 lions, compared to around 40 and 50 in 2020 and 2019, respectively. Naturally, this does not represent the reserve’s total lion population. However, this is a significant drop from previous years, and the call-up counts of 2021 were dominated by spotted hyena responses (80%). 141 spotted hyenas were counted in the 2021 census, compared to just under 80 the previous year. Lions and spotted hyenas are in direct competition, and a rise in hyena numbers could account for lower-than-expected lion populations.
Timbavati – According to the reserve ecologists, Timbavati has a population of between 55-60 lions which is in line with the long-term trend of the reserve.
Thornybush – The current resident lion population on Thornybush numbers 26 individuals. Reserve authorities estimate between 25 and 30 spotted hyenas.
Umbabat – The lion population was estimated at around 12 to 16 individuals, belonging to between two and three prides. The hyena numbers are believed to be approximately 50 to 60, and reports suggest that the population is growing.
LEOPARDS
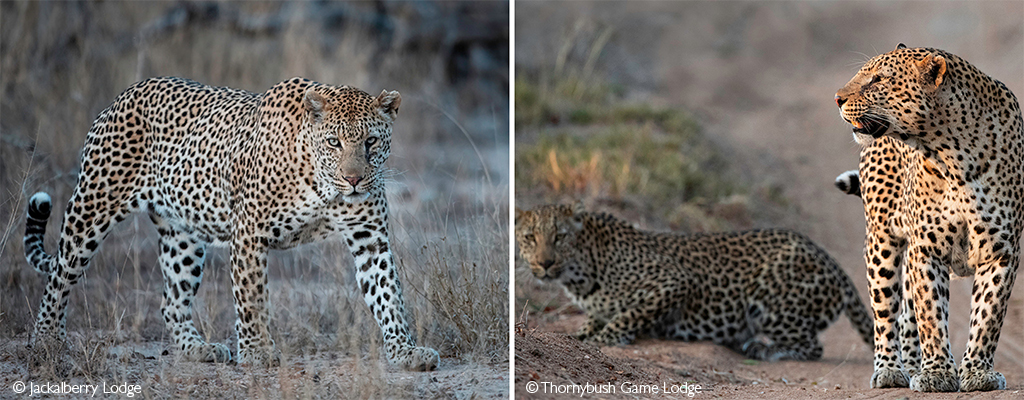
Entire APNR – Leopards are notoriously difficult animals to count, and those that do respond to call-ups are not representative of the total population. Klaserie and Umbabat anecdotally report healthy populations of leopards. The most robust data comes from Balule and Timbavati.
Balule – The Balule predator census combined call-up results with sightings data and camera trap images. The identification of individuals helped in this process, and Balule confidently estimates the number of leopards at around 76.
Timbavati – Timbavati has been conducting surveys of their leopard population since 2013 (except for 2020 due to COVID). In conjunction with the South African Leopard Monitoring Project (a cooperative effort between the NGO Panthera, SANBI and other partners), camera trap surveys have provided reliable long-term trends for the reserve. The reserve leopard monitoring reports note a significant drop in leopard densities in 2019. While the 2021 data records a slight increase, there has still been a concerning decline of 50% between 2018 to 2021. It is important to note that this decline refers to leopard densities, measured in the number of leopards per 100km2. Interestingly, the number of adult males and females has remained consistent between 2019 to 2021, but the number of young males appears to have decreased. The report offers a couple of suggested explanations for this, including lion movements, but emphasises the importance of long-term trend monitoring to inform management practices.
WILD DOGS
Entire APNR – Wild dogs utilise enormous home ranges except when packs are denning, before the pups can keep up. A pack counted on Balule one day could easily turn up on a neighbouring property the next day. As such, precision counting is next to impossible. Nevertheless, anecdotal evidence suggests that the APNR wild dog population is healthy and possibly even growing.
Balule – 22 wild dogs were recorded in Balule: three packs of five and one pack of seven individuals.
Klaserie – Reserve authorities report that wild dog populations have flourished in Klaserie in recent years, possibly due to water abundance, favouring impala population growth. The single largest pack size recorded on the reserve was 50 individuals!
Thornybush – At the time of writing, two packs regularly use Thornybush. One pack of six individuals is currently denning on the reserve.
Umbabat – Wild dog sightings are regularly reported in Umbabat, with pack sizes varying from eight to 30 individuals.
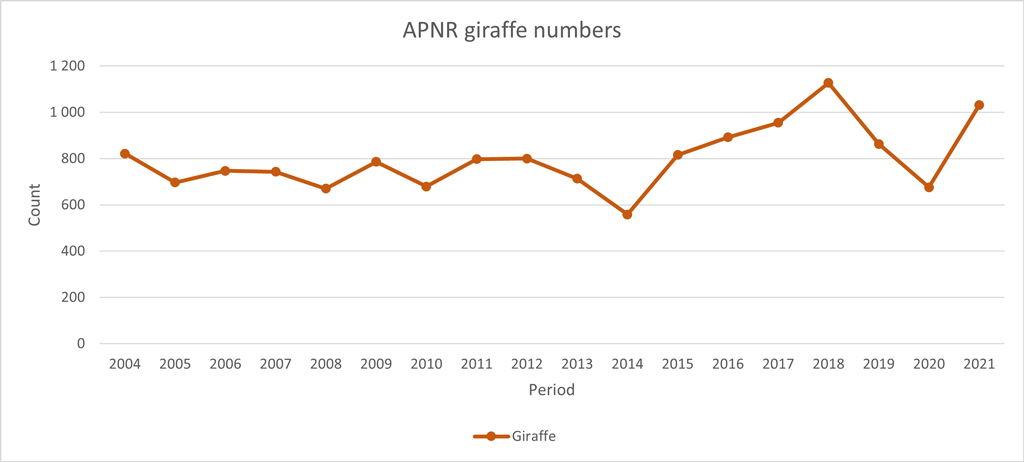
GIRAFFE
Entire APNR – Giraffe numbers in the APNR peaked at 1,127 in 2018 and have since remained stable when all five reserves are considered as a unit.
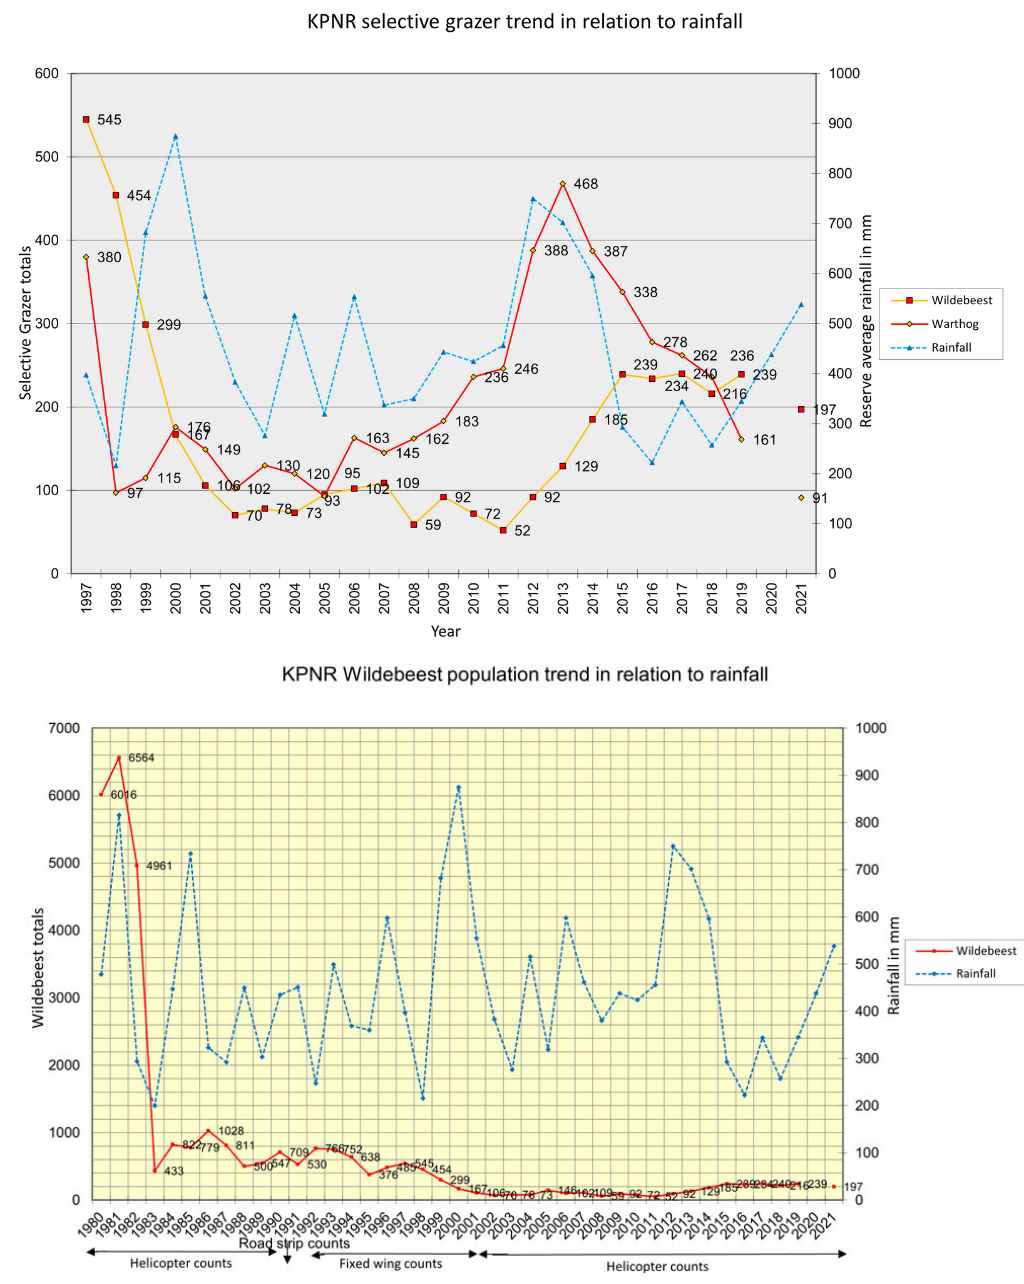
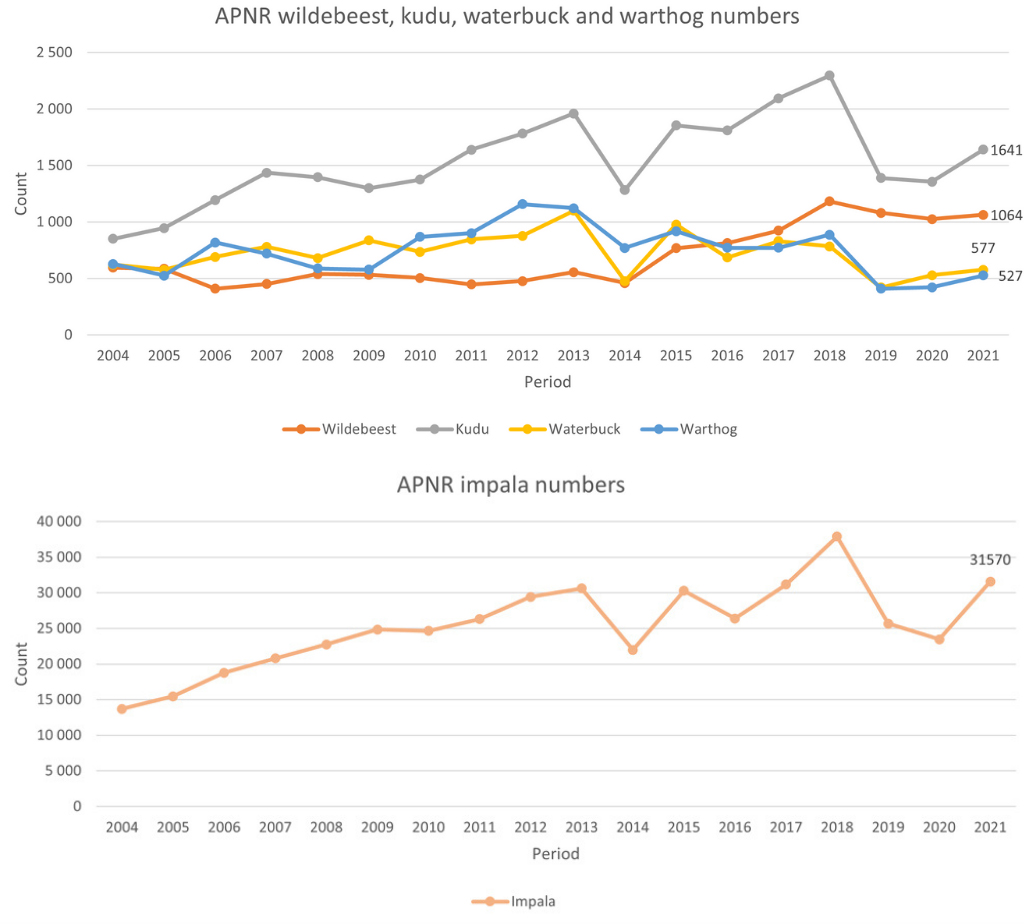
BLUE WILDEBEEST, KUDU, IMPALA, WATERBUCK AND WARTHOG
Entire APNR – Balule has recorded a significant decline in blue wildebeest (-57%), kudu (-44%), impala (-37%), waterbuck (-54%) and warthog (-63%) from 2018 until 2021. Population peaks and troughs have probably occurred naturally for millennia (especially before and after a drought). However, it is interesting that the same trend is not entirely mirrored in the counts from other APNR members. Where declines in the other reserves occurred over the same period, as was the case for impala, kudu and wildebeest numbers, the drop in populations was not nearly as substantial. The only comparable drop was seen in warthog numbers in Klaserie, which also decreased 61% (from 236 to 91) between 2018 and 2021. Waterbuck numbers increased in Klaserie and Thornybush, and kudu numbers nearly doubled in Umbabat.
Determining an exact explanation for this trend is just one example of the challenges that face those managing these wild spaces. Was it caused by increasing vegetation thickness making counting challenging? Could it be attributed to Balule’s comparatively high lion, hyena, and elephant densities? Is it just part of a natural cycle, or is there another, unseen explanation?
OTHER NOTEWORTHY POINTS
- Balule’s census indicates a concerning drop in crocodiles counted, down from over 120 in some years to just 30 individuals. The authors of the census report suggest that this warrants further investigation. In addition, comparing counts in the Kruger National Park would be interesting, as the Olifants River flows west through Balule and into the Kruger. It may be a counting artefact but could also indicate a problem with the health of the river ecosystem.
FINAL THOUGHTS
Counting animals comes with challenges (and strained eyes), but analysing the data is a far more cerebral and long-term exercise. Wildlife counts are vital to understanding any wilderness and significantly impact management decisions. Accurate population estimates and trends aid short-term and long-term decisions (like waterholes or hunting quotes, for example) and identify potential problems while there is still a chance to remedy them. However, an overarching perspective is often invaluable in the case of connected ecosystems – be it the APNR, the Kruger ecosystem, conservancies in East Africa or Transfrontier conservation areas.
What do you think about the ebb and flow of various species numbers in the APNR? We’d love to hear your thoughts. Follow the instructions below to download our APP and share your comments – it’s free!
Resources
Read more on the complicated processes around counting animals here.
Read more on the importance of good counts in aiding lion conservation here.
To comment on this story: Login (or sign up) to our app here - it's a troll-free safe place 🙂.![]()